Route local traffic
Configure gateway listeners, routes, and backends from a visual workspace.

OPEN SOURCE / DEBUGGING WORKBENCH
See what happens between request and response.
Route local requests, inspect HTTP traffic, explore logs, and monitor your system in one desktop workspace.
Desktop debugging workbench
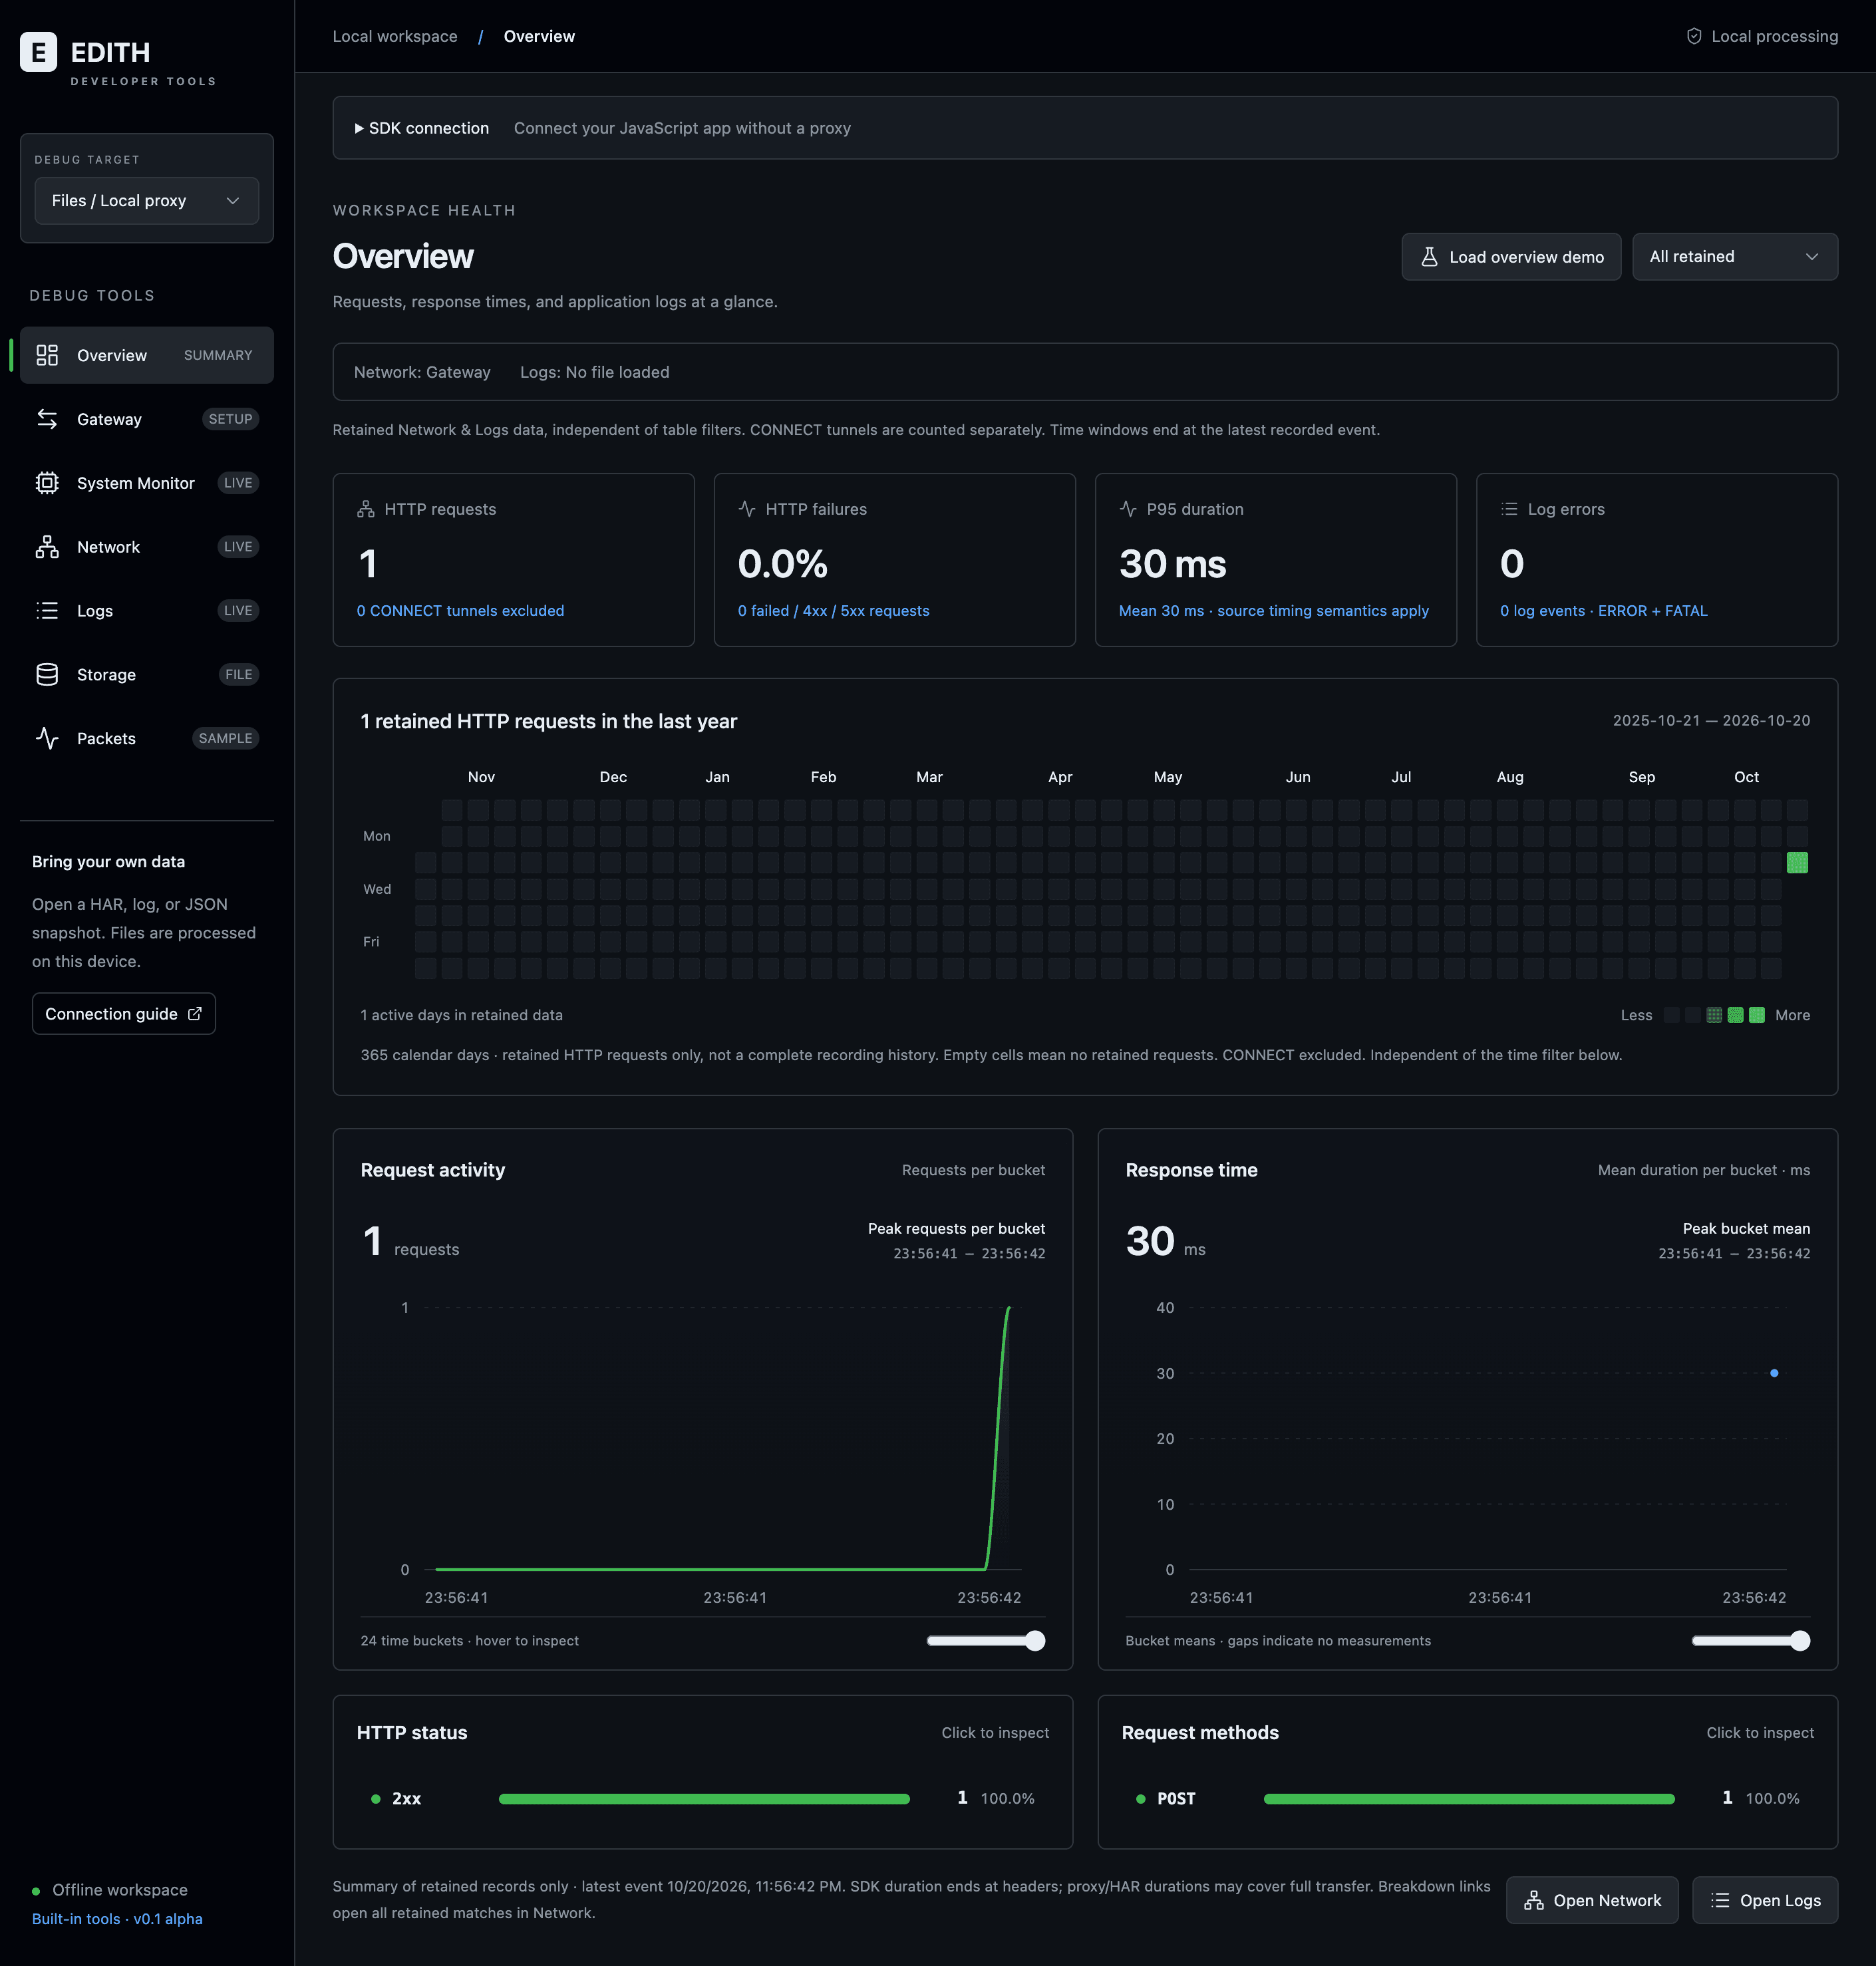
Configure gateway listeners, routes, and backends from a visual workspace.
Filter captured gateway traffic and inspect request and response details alongside logs.
Track CPU and memory use while you debug.